Quadratic Functions - Lesson 1
So far in our study of Algebra, we have discovered all of the ins and outs of linear equations and functions. We know that linear equations graph a straight line, so I wonder what a quadratic function is going to look like?
Let's take a look!
A quadratic function is always written as:
f(x) = ax2 + bx + c
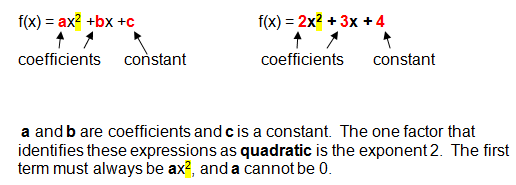
Ok.. let's take a look at the graph of a quadratic function, and define a few new vocabulary words that are associated with quadratics.
- The graph of a quadratic function is called a parabola. A parabola contains a point called a vertex. The parabola can open up or down.
- If the parabola opens up, the vertex is the lowest point. This point is called the minimum point.
- If the parabola opens down, the vertex is the highest point. This point is called the maximum point
- A parabola also contains two points called the zeros or some people call these the x-intercepts. The zeros are the points were the parabola crosses the x-axis.

Now, we will use a table of values to graph a quadratic function. Remember that you can use a table of values to graph any equation.
There are a few tricks when graphing quadratic functions. We must make sure that we find a point for the vertex and a few points on each side of the vertex.
Example 1: Using a Table of Values to Graph Quadratic Functions
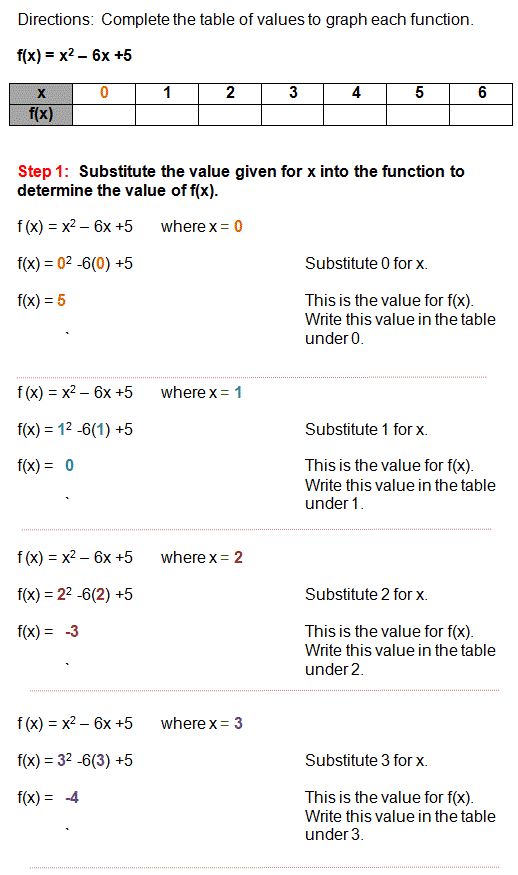
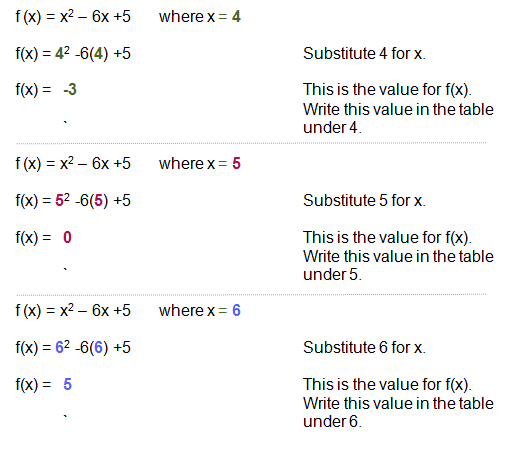
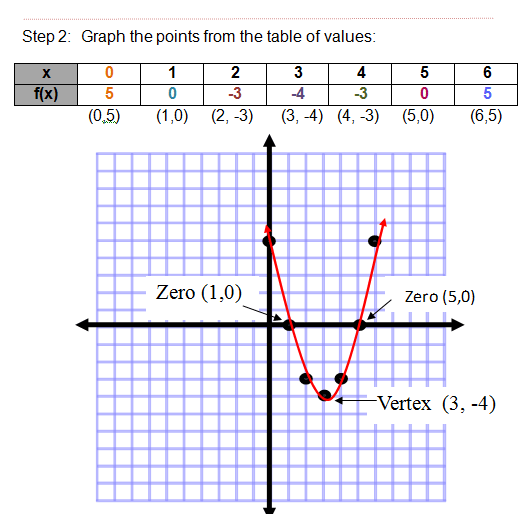
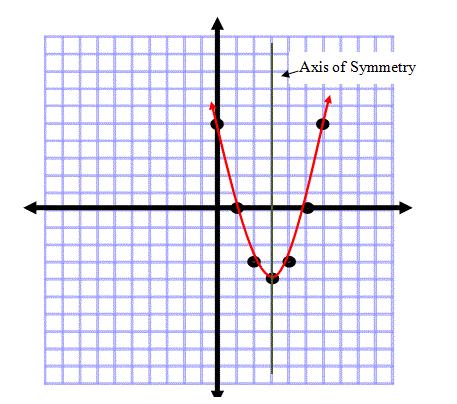
Notice that after graphing the function, you can identify the vertex as (3,-4) and the zeros as (1,0) and (5,0).
So, it's pretty easy to graph a quadratic function using a table of values, right? It's just a matter of substituting values for x into the equation in order to create ordered pairs.
There are a lot of other cool things about quadratic functions and graphs. Locate the vertex on the completed table of values. Do you notice any patterns? Look specifically at the f(x) values.
Notice how the f(x) values start to repeat after the vertex? Quadratic functions are symmetrical. If you draw an imaginary line through the vertex, this is called the axis of symmetry.
Now check out the points on each side of the axis of symmetry. Pretty cool, huh?
Practice Problem
Directions: Use the table of values to graph the following function:
f(x) = -x2 - 6x -1
Then identify the vertex of the function.
Click here to print out graph paper.

Answer Key
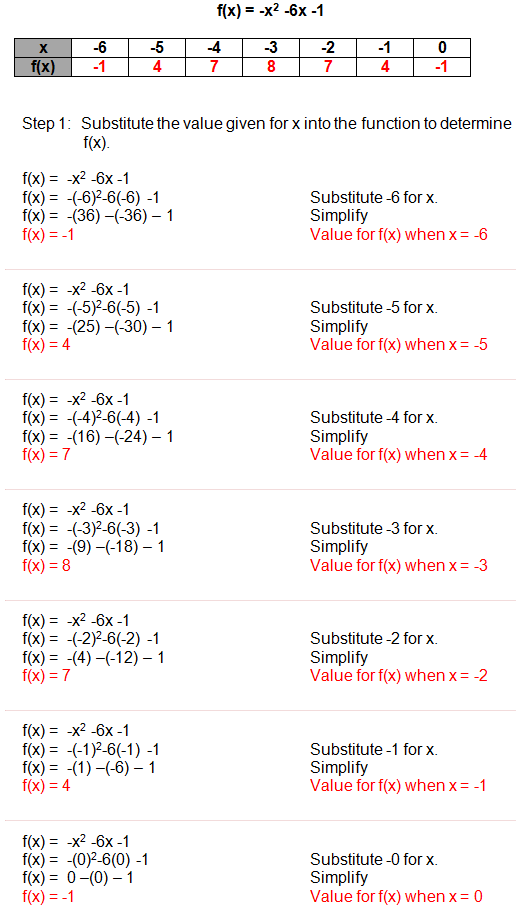
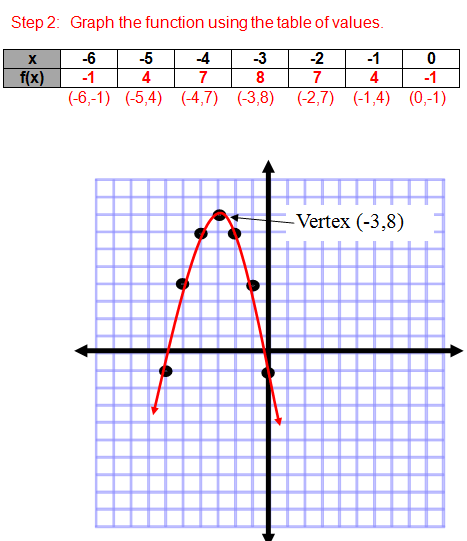
Notice that the zeros of the function are not identifiable on the graph. (They contain decimals which we can not accurately read on this graph).
The vertex for the parabola is (-3,8).
This parabola opens down; therefore the vertex is called the maximum point.
Can you guess which factor in the function determines whether the parabola opens up or down?
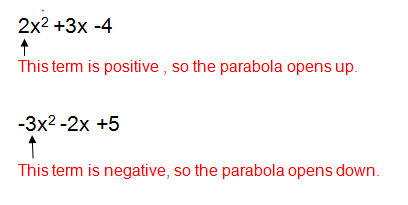
It's the sign of the first term (the squared term). In the function:
f(x) = ax2 + bx + c
If a is positive the parabola opens up and the vertex is the minimum point.
If a is negative, the parabola opens down and the vertex is the maximum point.
For more help with quadratic functions, see lesson 2 on quadratics.

Need More Help With Your Algebra Studies?
Get access to hundreds of video examples and practice problems with your subscription!
Click here for more information on our affordable subscription options.
Not ready to subscribe? Register for our FREE Pre-Algebra Refresher course.


Comments
We would love to hear what you have to say about this page!