Graphing Slope
Accurately graphing slope is the key to graphing linear equations. In the previous lesson, Calculating Slope, you learned how to calculate the slope of a line.
In this lesson, you are going to graph a line, given the slope.
We are still going to use the definition of slope, which is:
Slope = rise/run
Instead of counting the rise and run until you reach the next point, you are going to count the rise and run to plot the next point. You must have at least two points to draw a line.
Let's take a look at the directions and an example.
Steps for Graphing a Line With a Given Slope
- Plot a point on the y-axis. (In the next lesson, Graphing with Slope Intercept Form, you will learn the exact point that needs to be plotted first. For right now, we are only focusing on slope.)
- Look at the numerator of the slope. Count the rise from the point that you plotted. If the slope is positive, count up and if the slope is negative, count down.
- Look at the denominator of the slope. Count the run to the right.
- Plot your point.
- Repeat the above steps from your second point to plot a third point if you wish.
- Draw a straight line through your points.
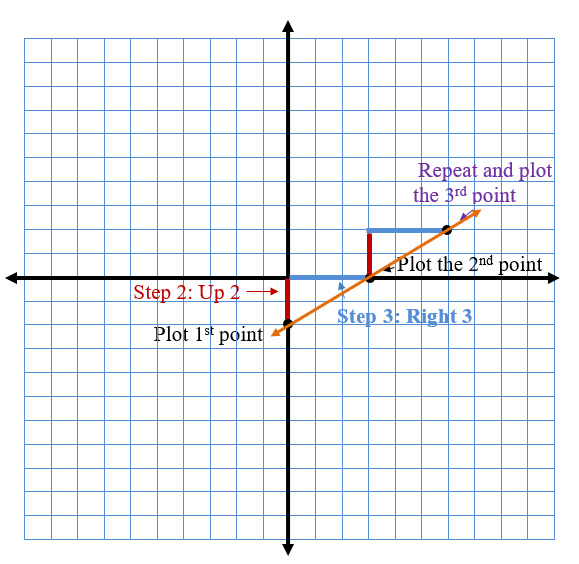
Example 1 shows how to graph a line with a slope of 2/3. In this example, we are only focusing on how to count the slope and plot the next point. We are not graphing an actual equation.
If you need help with graphing an actual equation and need to know which point to plot first, visit our lesson on Slope Intercept Form.
Example 1: Graphing a Positive Slope
Start with the point (0,-2). Graph a line with a slope of 2/3.

Slope of 2/3
Slope = 2 rise/ 3 run
1. Plot the 1st point. (0,-2)
2. Count the rise. Since the rise is positive 2, I counted up 2.
3. Count the run. Since the run is positive 3, I counted to the right 3.
4. Plot your second point. This point is (3,0)
5. Repeat the process to plot a third point.
6. Draw a straight line through your points.
In the next example, we will graph a line with a negative slope.
One other thing to think about as we complete Example 2...
What do we do when the slope doesn't have a denominator?
Let's say the slope is -3. Can we write -3 as a fraction?
Yes.. we can make any integer a fraction by dividing by 1. So, -3/1 is the fraction used to graph slope.
Negative Slopes are Tricky!
The trickiest part about graphing slope is knowing which way to rise and run if the slope is negative!
If the slope is negative, then only one - either the numerator or denominator is negative (NOT Both!)
Remember your rules for dividing integers? If the signs are different then the answer is negative!
If the slope is negative you can plot your next point by going down and right OR up and left.
f the slope is positive you can plot your next point by going up and right OR down and left.
Example 2: Graphing a Negative Slope
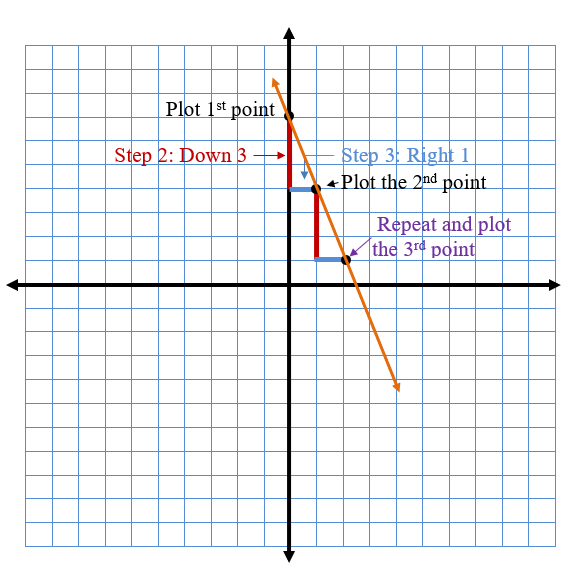
Start with the point (0,7). Graph a line with a slope of -3.

Slope = -3
Slope = -3 rise/1 run
1. Plot the 1st point. (0,7)
2. Count the rise. (We went down 3 since the slope was negative.
3. Count the run. (The denominator is 1, so we went right 1)
4. Plot the 2nd point.
5. Repeat the process if you'd like to plot a 3rd point.
6. Draw a line through your points.
Take a look at the following video if you need this concept explained further.
Let's take a look at a few notes that will help you make sure your graphs are correct when graphing linear equations.
- When reading the graph from left to right, the line rises if the slope is positive.
- When reading the graph from left to right, the line falls if the slope is negative.
- The line gets steeper as the absolute value of the slope get larger. (look at the numeral of the slope, not the sign)
- For example a slope of 2 is steeper than a slope of 1/4. A slope of -3 is much steeper than a slope of 1.
Remember these tips about graphing slope because as you start to graph equations and you will be able to check your work to make sure that your graph is correct!
Now that you know how to graph slope, you are ready to move onto using Slope Intercept Form to graph your equations.

Need More Help With Your Algebra Studies?
Get access to hundreds of video examples and practice problems with your subscription!
Click here for more information on our affordable subscription options.
Not ready to subscribe? Register for our FREE Pre-Algebra Refresher course.


Comments
We would love to hear what you have to say about this page!