Graphing Inequalities
Graphing inequalities is very similar to graphing linear equations.
Once your linear equation is graphed, you then must focus on the inequality symbol and perform two more steps. It's pretty easy and fun. Stick with me and you'll have no problems by the end of this lesson.
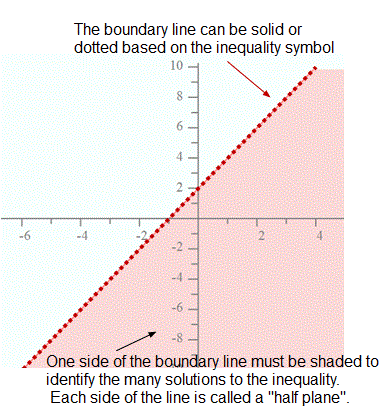
This is a graph for a linear inequality. Notice how we have a boundary line (that can be solid or dotted) and we have a half plane shaded. (Hint: These are the two extra steps that you must take when graphing inequalities.)
In order to succeed with this lesson, you will need to remember how to graph equations using slope intercept form.
There will be two additional steps that you must take when graphing linear inequalities.
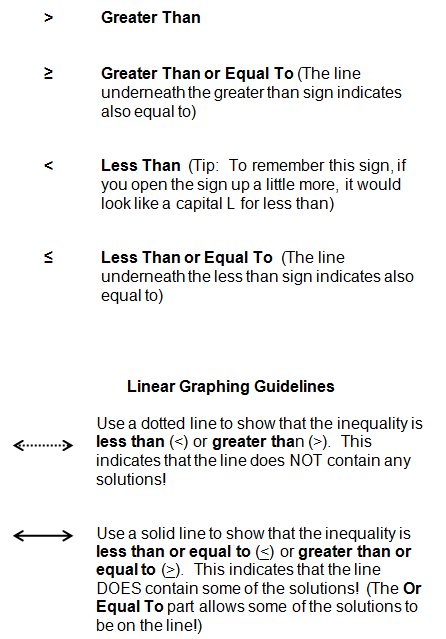
As shown in this image, the first step will be to determine whether you will use a solid boundary line or a dashed boundary line. The inequality symbol will help you to determine the boundary line.
If the inequality symbol is greater than or less than, then you will use a dotted boundary line. This means that the solutions are NOT included on the boundary line.
If the inequality symbol is greater than or equal to or less than or equal to, then you will use a solid line to indicate that the solutions are included on the boundary line.
The second step will be to determine which half plane to shade.
If this all sounds confusing, don't worry.... Take a look at the examples below and it will all make sense.
So... first let's take a look at our graphing symbols. You may want to keep this handy for a reference.
Example 1 - Graphing Inequalities
Graph the inequality: y < 2x + 2
Step 1: Graph the inequality as you would a linear equation.
Think of: y = 2x + 2 when you create the graph.
Remember to determine whether the line is solid or dotted. In this case, since the inequality symbol is less than (<), the line is dotted. The points on the line are NOT solutions!
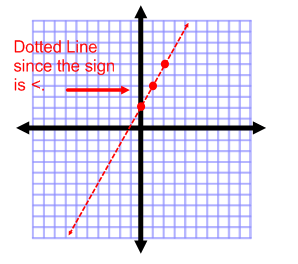
Step 2: Determine which side of the line contains the solutions. Since y is less than the expression, you will shade below the line.
If you are unsure of which side to shade, pick any point on the graph (that's not on the line). You are choosing a test point to determine which side contains the solutions.
I will choose (0,0) because this is the easiest point to substitute into the inequality to check for solutions.
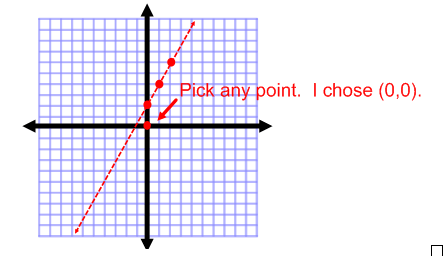
Step 3: Substitute (0,0) into the inequality
y < 2x + 2
0 < 2(0) + 2
0 < 2
This is a TRUE statement. 0 is less than 2.
Since (0,0) is a solution and is to the right of the line, ALL of the points to the right of the line are solutions!
Therefore, we will lightly shade the area to the right of the line to show that this side of the line contains all of the solutions to the inequality.
Step 4: Shade the side of the line that contains the solutions to the inequality.
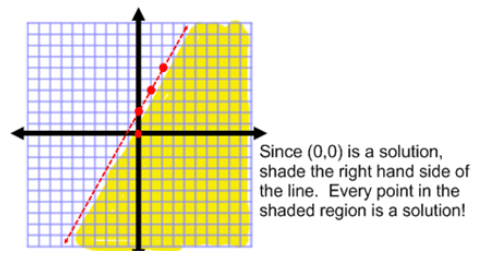
Did you notice how our boundary line was a dotted line because of the less than symbol that was used in the inequality?
Also, you may have realized that you shade below the dotted line because of the less than symbol in the inequality. However, if you are unsure you can always choose a test point. I always use the point (0,0) if it's not on the line.
Substitute (0,0) into the original inequality. If the math sentence is true once you substitute (0,0), then that means that (0,0) is a solution and you shade the half plane that contains (0,0). If the math sentence is false when you substitute (0,0), then that means that (0,0) is not a solution and the other half plane (or the side of the line that does not contain (0,0) should be shaded.
For this second example, we'll need to rewrite the equation so that it's in slope intercept form before we graph. Also take note that the sign is greater than or equal to, so we will graph a solid line this time instead of a dotted line. This example will also demonstrate how to choose three solutions to the inequality.
Example 2: Rewriting the Inequality in Slope Intercept Form.
Graph the following inequality. Then identify three solution to the inequality.
3y > 2x - 6
Step 1: We need to rewrite the inequality so that it is in slope intercept form.

Step 2: Graph the line. Note that the line is solid because the inequality sign is greater than or equal to.
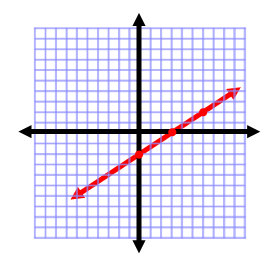
Step 3: Shade the solution set. Since y is greater than the expression, shade the side "above" the line.
If you are unsure, pick a "test" point to determine which side of the line you should shade to show the solutions to the inequality.
I am going to choose (0,0) again.
3y > 2x - 6
3(0) > 2(0) - 6
0 > -6
Since 0 is greater than -6, we will shade above the line that since it contains (0,0).
Step 4: Shade your graph.
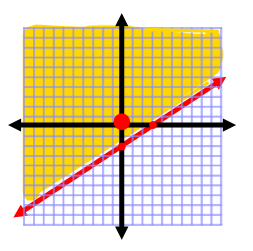
Step 5: Identify three points that are solutions to the inequality. This means that you can pick any three points that are in the shaded area.
Three points that are solutions are:
(1,2) (-4,2) and (-3, -2)
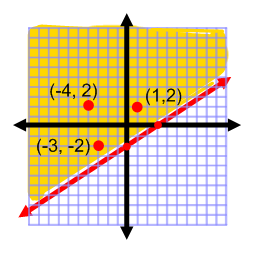
You may have chosen three completely different solutions, but as long as they are contained in the shaded area, they are solutions to the inequality.
How can you verify that they are solutions?
Substitute the ordered pairs into the inequality!
Let's substitute (1,2)
3(2) > 2(1) - 6
3(2) > 2(1) - 6
6 > -4
6 is greater than -4. Since this is a true statement, (1,2) is a solution to the inequality.
I hope this helps you to understand how to graph linear inequalities. If you want to practice a few problems on your own, check out our graphing inequalities practice problems.
Still struggling with inequalities? Check out our other inequality lessons as you continue your studies.

Need More Help With Your Algebra Studies?
Get access to hundreds of video examples and practice problems with your subscription!
Click here for more information on our affordable subscription options.
Not ready to subscribe? Register for our FREE Pre-Algebra Refresher course.


Comments
We would love to hear what you have to say about this page!